A thermal satellite can show that certain urban surfaces emit more radiation than a park or a wetland. One is tempted to conclude that "it is so many degrees in this street." This is not what the instrument directly measures. Landsat provides an estimate of surface temperature at the time of passage; an outdoor thermometer measures the air temperature at a specific location and at a defined height. Confusing the two would turn a useful map into bad health advice.
Two temperatures, two experiences
A metal roof exposed to the sun can be much hotter than the air around it. A shaded street may be more pleasant for a pedestrian, even if the adjacent ground remains warm. The perceived temperature also depends on humidity, wind, and the radiation received by the body. A thermal map alone therefore does not allow us to conclude about the risk to an elderly person or the effectiveness of a planting policy. We must determine which phenomenon we wish to analyze.
NASA has published a study of the growth of Benin City, Nigeria, which shows how satellite data can document urban expansion. This study is a methodological reference, not a map of Douala. Reusing a Nigerian figure under a Cameroonian title would mislead the reader. For Douala, one must choose genuine city scenes, publish their identifiers, and conduct a transparent processing.
The quality of the scene matters more than its aesthetics
The Landsat Collection 2 surface temperature product is calculated from thermal observations and auxiliary information, including atmospheric and material emissivity. These assumptions introduce uncertainties. Tropical cloud cover complicates the analysis: a cloud can obscure the ground, and a shadow can temporarily cool a surface without representing its usual state. Water surfaces, industrial areas, bare ground, and vegetated neighborhoods must be compared at comparable dates and times.
A single scene does not tell a story about a trend. The team should select several comparable season days, flag outlier pixels, and document the conversion of values. A legend with gradations, a scale, and a mask for missing data are essential. It would be dishonest to color all densely built neighborhoods in bright red if the pixels are not valid or if the palette is intentionally exaggerated.
A possible field protocol
Shadowed, constant-height, repeated-hour measurements can complement the orbital image. The protocol should note the type of thermometer, the duration of stabilization, the presence of rain, wind, and the immediate environment. One can compare a wooded area and a highly mineralized site, but one should avoid choosing only examples that confirm the hypothesis. A mobile measurement provides a map of air temperature along a route; it should not be presented as a perfect validation of each Landsat pixel, since the times and physical quantities differ.
The inhabitants have valuable observations about difficult places in hot hours. These accounts guide research and the selection of measurement points. They should neither be discarded in favour of a map nor transformed without method into quantitative data. A solid dossier shows where the sources converge and where they diverge.
Build an honest comparison
Before comparing two neighborhoods, it is necessary to define what they have in common and what distinguishes them. A wooded area near water and a highly mineral industrial area differ in more than just their trees. A useful comparison involves multiple locations, noting the vegetation cover, dominant materials, and time of day. It also points out pixels obscured by clouds. If a clear scene exists only for part of Douala, the rest of the city should not be colored by silent interpolation.
A multi-year study requires additional precautions. Sensors, correction methods, and season must be harmonized. A difference between two maps may result from a change in algorithm or a recent rain event. It is better to present a series with its limitations than to proclaim "the city has gained three degrees" based on two non-comparable images. Official surface temperature products provide quality indicators that processing must take into account.
Move from diagnosis to testable action
Suppose a mineral site appears to be consistently hot. One might consider planting trees, creating shade, or changing the surface cover. But the expected effect must be formulated: surface temperature as the satellite passes, air temperature in the middle of the afternoon, pedestrian comfort, energy consumption? Each requires a different measurement. Planting a tree today does not immediately produce a protective canopy; maintenance, water, and use of the site all count.
A small before-and-after experiment, with a control site and repeated surveys, would provide more useful evidence than a photomontage. Residents should also be able to say whether the intervention is interfering with a business, reducing a path, or actually improving the wait at a stop. The spatial map is used to make a hypothesis and to follow a surface; it does not replace this on-the-ground deliberation.
Do not confuse exposure and vulnerability
A map of hot surfaces does not show who is walking down the street, at what time, or for how long. A hot spot that is rarely used does not pose the same problem as a bus stop with no shade where many people are waiting. Age, health, access to water, and mobility also affect risk. A study for public action should therefore bring together data on usage and social observations, without unnecessarily publishing personal information. The heat of a pixel is an environmental signal, not a direct measure of human harm.
Nights deserve a separate examination. Landsat operates on a fixed schedule and does not by itself describe the nighttime cooling of a street. However, uninterrupted thermal periods can be important for comfort and health. Ground-based sensors placed in multiple neighborhoods, maintained and calibrated over time, can add this dimension. Again, exposure must be controlled: a thermometer in the sun or attached to a wall does not measure the same thing as a protected, ventilated instrument.
What would be a publishable map
A final figure should display the date and time of the scene, the Landsat identifier, the algorithm or product used, the units, the masked areas, and a non-exaggerated legend. A second figure may show the ground measurement points, with their method, without disclosing private addresses. The text will explain the differences between the two types of temperature. If the result is based on only a few clear days, the title should not refer to the "average temperature in Douala" for an entire season.
This level of precision does not make the article less readable. It allows the reader to understand why a particular neighborhood appears hotter on an image, and why a proposed intervention still needs to be tested on the ground.
The retained scenes and those excluded due to cloud cover should be listed together. This registry avoids selecting only the days that reinforce a preconceived story about the heat in a particular neighborhood.
What this changes – or does not change – for Central Africa
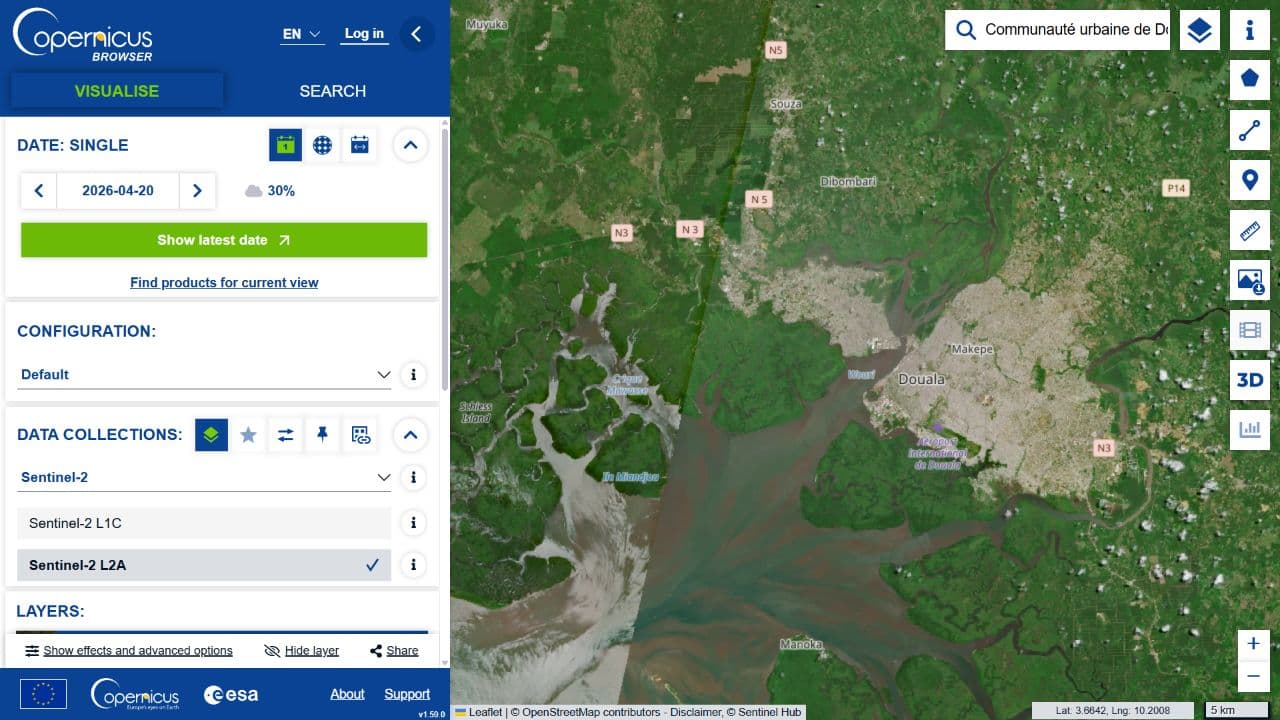
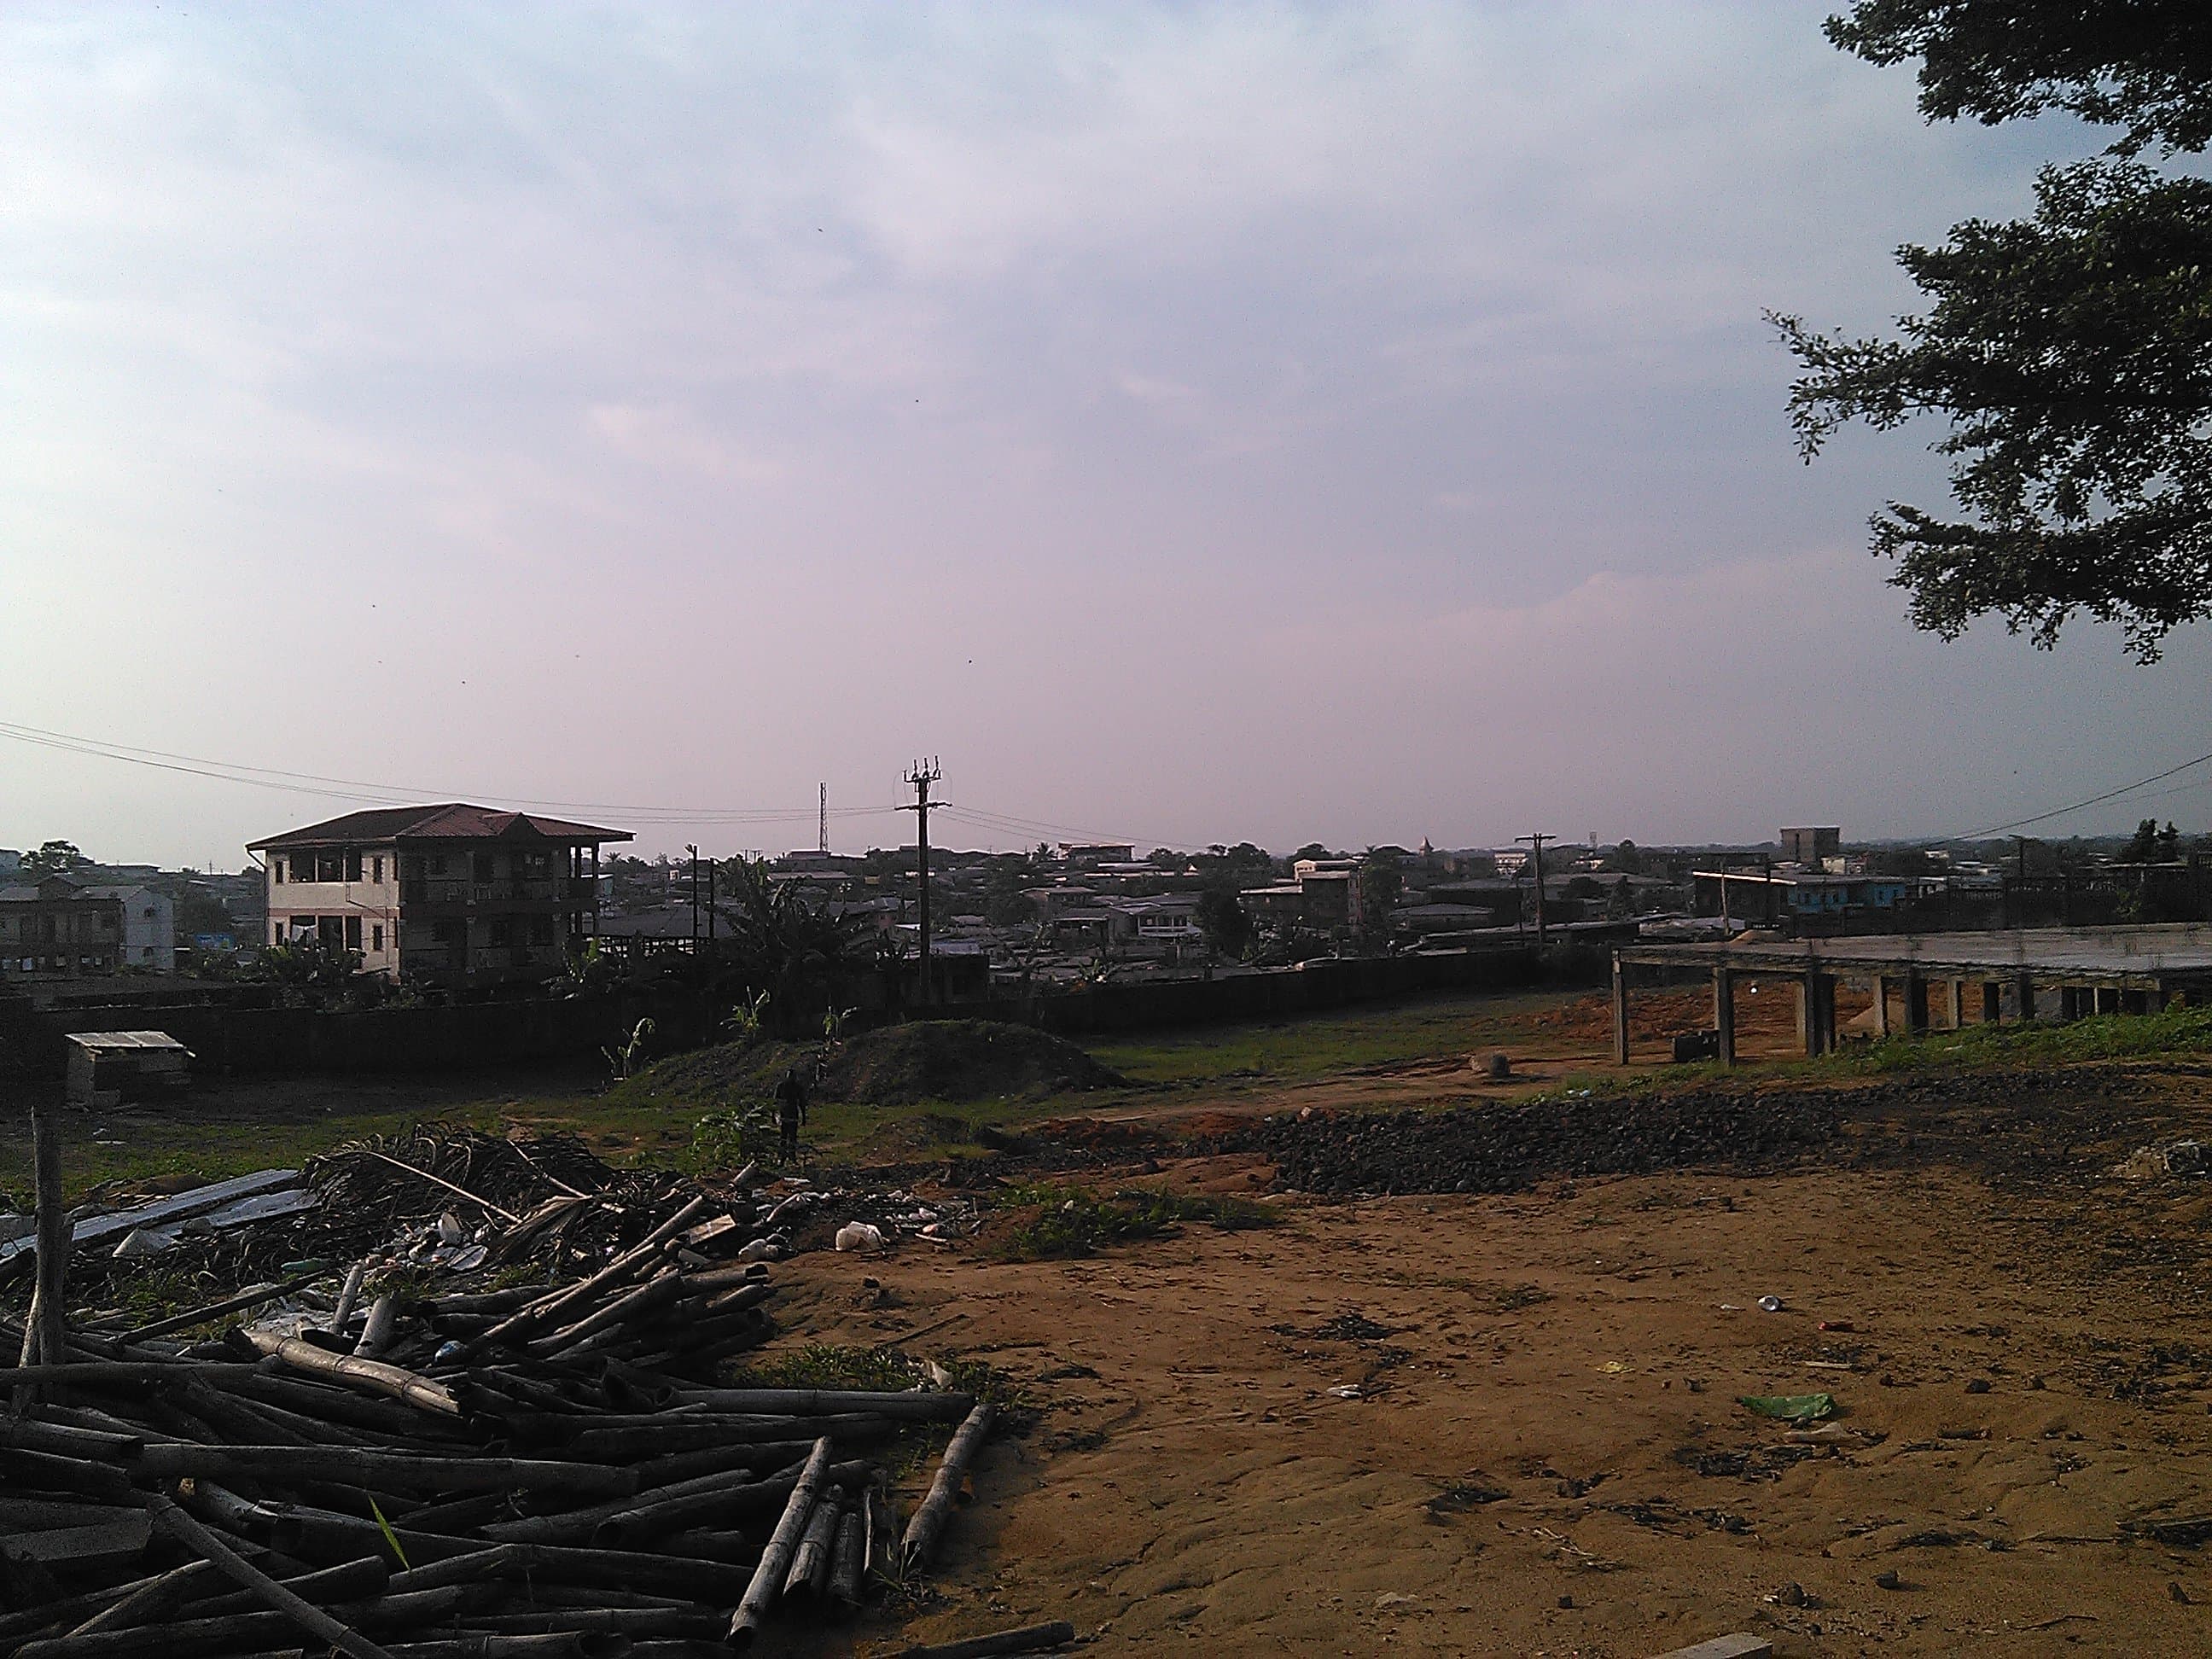
For Douala, a useful next step would be an authentic thermal map, accompanied by a small table of ground measurements and an explanation of the limitations. This could help to formulate questions about shade, materials, and access to cool spaces. It would not, by itself, tell us how many people are exposed or what intervention would be most effective. Demographic data, site uses, and neighborhood constraints should be studied separately. This dossier explains a method and does not publish any measured results on the heat of Douala; its opening photograph locates the city, without claiming to be a Landsat map.