
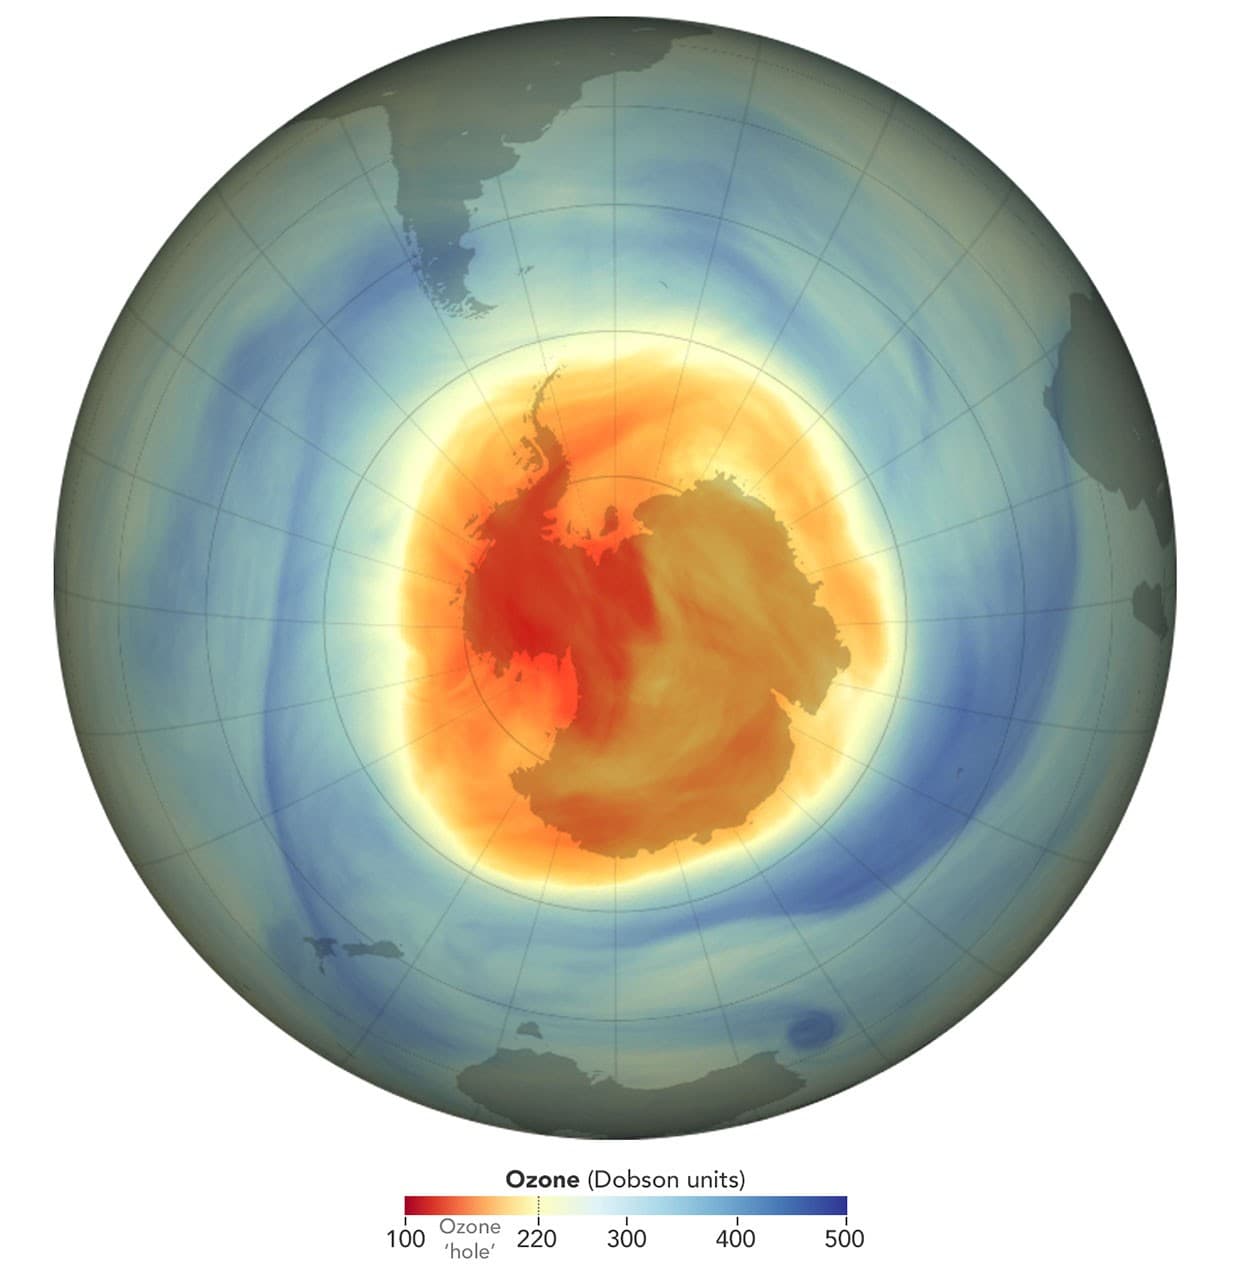
On November 4, 2026, NASA and NOAA released their annual report on the Antarctic ozone hole. Its average area during the maximum depletion period reached about 25 million square kilometers between September 7 and October 13. Of the 48 years of monitoring, 2026 ranks seventh in terms of size. However, the agencies emphasize that the ozone layer continues its long-term recovery. The two statements are compatible. An exceptional atmospheric circulation year can produce a large hole despite the gradual decline in substances that destroy ozone.
What really measures the "size of the hole"
The ozone hole is not an empty opening above Antarctica. It is an area where the concentration of ozone in the stratosphere falls below a historical threshold, usually set at 220 Dobson units. A Dobson unit measures the total amount of ozone in a column of air. The area of a region below that threshold and the minimum amount of ozone above a particular point are two different quantities. A region may be extensive without reaching the most severe minima observed in the past.
NASA notes that the 2026 surface maximum was reached on September 18, at about 27.1 million square kilometers. This value is not the seasonal average of 25 million. NOAA also measured a minimum concentration of 105 Dobson units over the South Pole on October 17. Confusing these three numbers — maximum surface, average surface, and local minimum concentration — would produce a misleading headline. The map accompanying the announcement represents the situation on a given day; it does not, by itself, tell the whole story of the season.
The role of the polar vortex
In the spring in the Southern Hemisphere, the polar stratosphere can remain very cold and relatively isolated by strong winds forming the polar vortex. These conditions favour chemical reactions that activate chlorine and bromine from man-made substances. When the sun returns in the spring, these compounds contribute to the destruction of ozone. The magnitude of the phenomenon therefore depends both on the amount of substances present and on the meteorological conditions in the upper atmosphere. That is why the annual surface varies widely.
In 2026, researchers from NASA and NOAA described a particularly large and persistent vortex. Large-scale atmospheric motions, which usually contribute to disrupting this vortex, were weak in August and September. The area favorable to depletion was thus larger. This explanation does not negate the historical responsibility of ozone-depleting substances: it indicates why stratospheric weather can amplify a particular season while concentrations of these substances slowly decline.
Why the recovery trend remains credible
The Montreal Protocol, adopted in 1987, led countries to reduce the production and use of many ozone-depleting compounds. However, these molecules can remain in the atmosphere for decades or escape from old equipment. The ozone layer's response is not like the immediate stopping of a water leak. It takes many years, taking into account weather variations. NASA and NOAA estimate that the concentration of Antarctic stratospheric chlorine related to these substances has decreased from its highest levels.
The agencies also note that the 2026 hole, while wide, was not as deep as the major historical seasons. According to their estimate, the same weather pattern would have produced an even larger area if concentrations of ozone-depleting substances had remained at the levels of the early 2000s. This is a model-based comparison, not a second Earth observed, and it helps to separate the effects of environmental policy from those of a particular atmospheric season.
Satellites, ballons and ground measurements
Monitoring is not based on a single image. Satellites provide repeated observations over a large region, while balloons equipped with sensors measure the ozone profile at different altitudes. Ground-based instruments also serve as a check. In the 2026 assessment, data from several space platforms, including Aura, NOAA-20, NOAA-21, and Suomi NPP, were used. Comparing these sources helps detect measurement biases and understand what is changing in space and over time.
For a reader in Cameroon, it is important to avoid another confusion: stratospheric ozone protects against ultraviolet radiation, while ground-level ozone is an atmospheric pollutant. The same word refers to the same molecule, but the health implications and mechanisms are very different. The map of the Antarctic hole does not directly indicate the air quality in Douala or the local UV exposure on a given day. These issues require other observations and different scales of analysis.
A lesson in reading environmental indicators
The November 4 announcement underscores the importance of looking at the duration, depth, and extent of a phenomenon before assessing a trend. A single extreme year may coexist with improvement over several decades. Conversely, the existence of overall improvement does not allow us to ignore an unusual season. Good news should say what has been measured, what has been explained by models, and what remains uncertain about the future evolution of the vortex.
Scientists predict a slow, decades-long recovery, rather than an immediate return to the previous situation. Readers can follow updated data from NASA's Ozone Watch and measurements from NOAA. This feature reminds us that a striking map should be accompanied by a method: threshold, date, unit, instrument, historical comparison, and uncertainty. It is this method that makes the information useful beyond the headline.
What ozone changes for residents
Stratospheric ozone absorbs some of the Sun's ultraviolet radiation. Its depletion may increase UV exposure at the surface, with possible consequences for human health and ecosystems. However, one should not directly translate the surface of the Antarctic ozone hole into an exposure forecast for a city: latitude, season, cloud cover, altitude, and the angle of the Sun also play a role. Local UV index bulletins address a different, more immediate question than the ozone hole map. A reader in Cameroon must distinguish between these two scales before drawing a conclusion for his daily activities.
The expected recovery is based on the global reduction of ozone-depleting substances, organized in particular by the Montreal Protocol. This collective action does not immediately remove molecules already present in the atmosphere. Some persist for a long time, and the weather conditions of a given year can accelerate or slow down the depletion over Antarctica. The best comparison, therefore, is over a long period and several indicators, with particular attention to annual variability. It would be misleading to declare the problem solved after a short season, or to conclude that international policy has failed after a long one.
How to tell the story of the next season
To follow up on 2027, we can look at comparable dates for the maximum area, the average area during the active period, and the minimum concentration measured by the instruments. We should also ask whether the calculation methods have changed and whether the old series have been recalibrated. A spectacular satellite image catches the eye; a graph spanning several decades provides context. Students can replicate this work with open data, noting the units and uncertainties. It’s a concrete opportunity to learn how public policy, atmospheric chemistry, and weather interact without merging.