
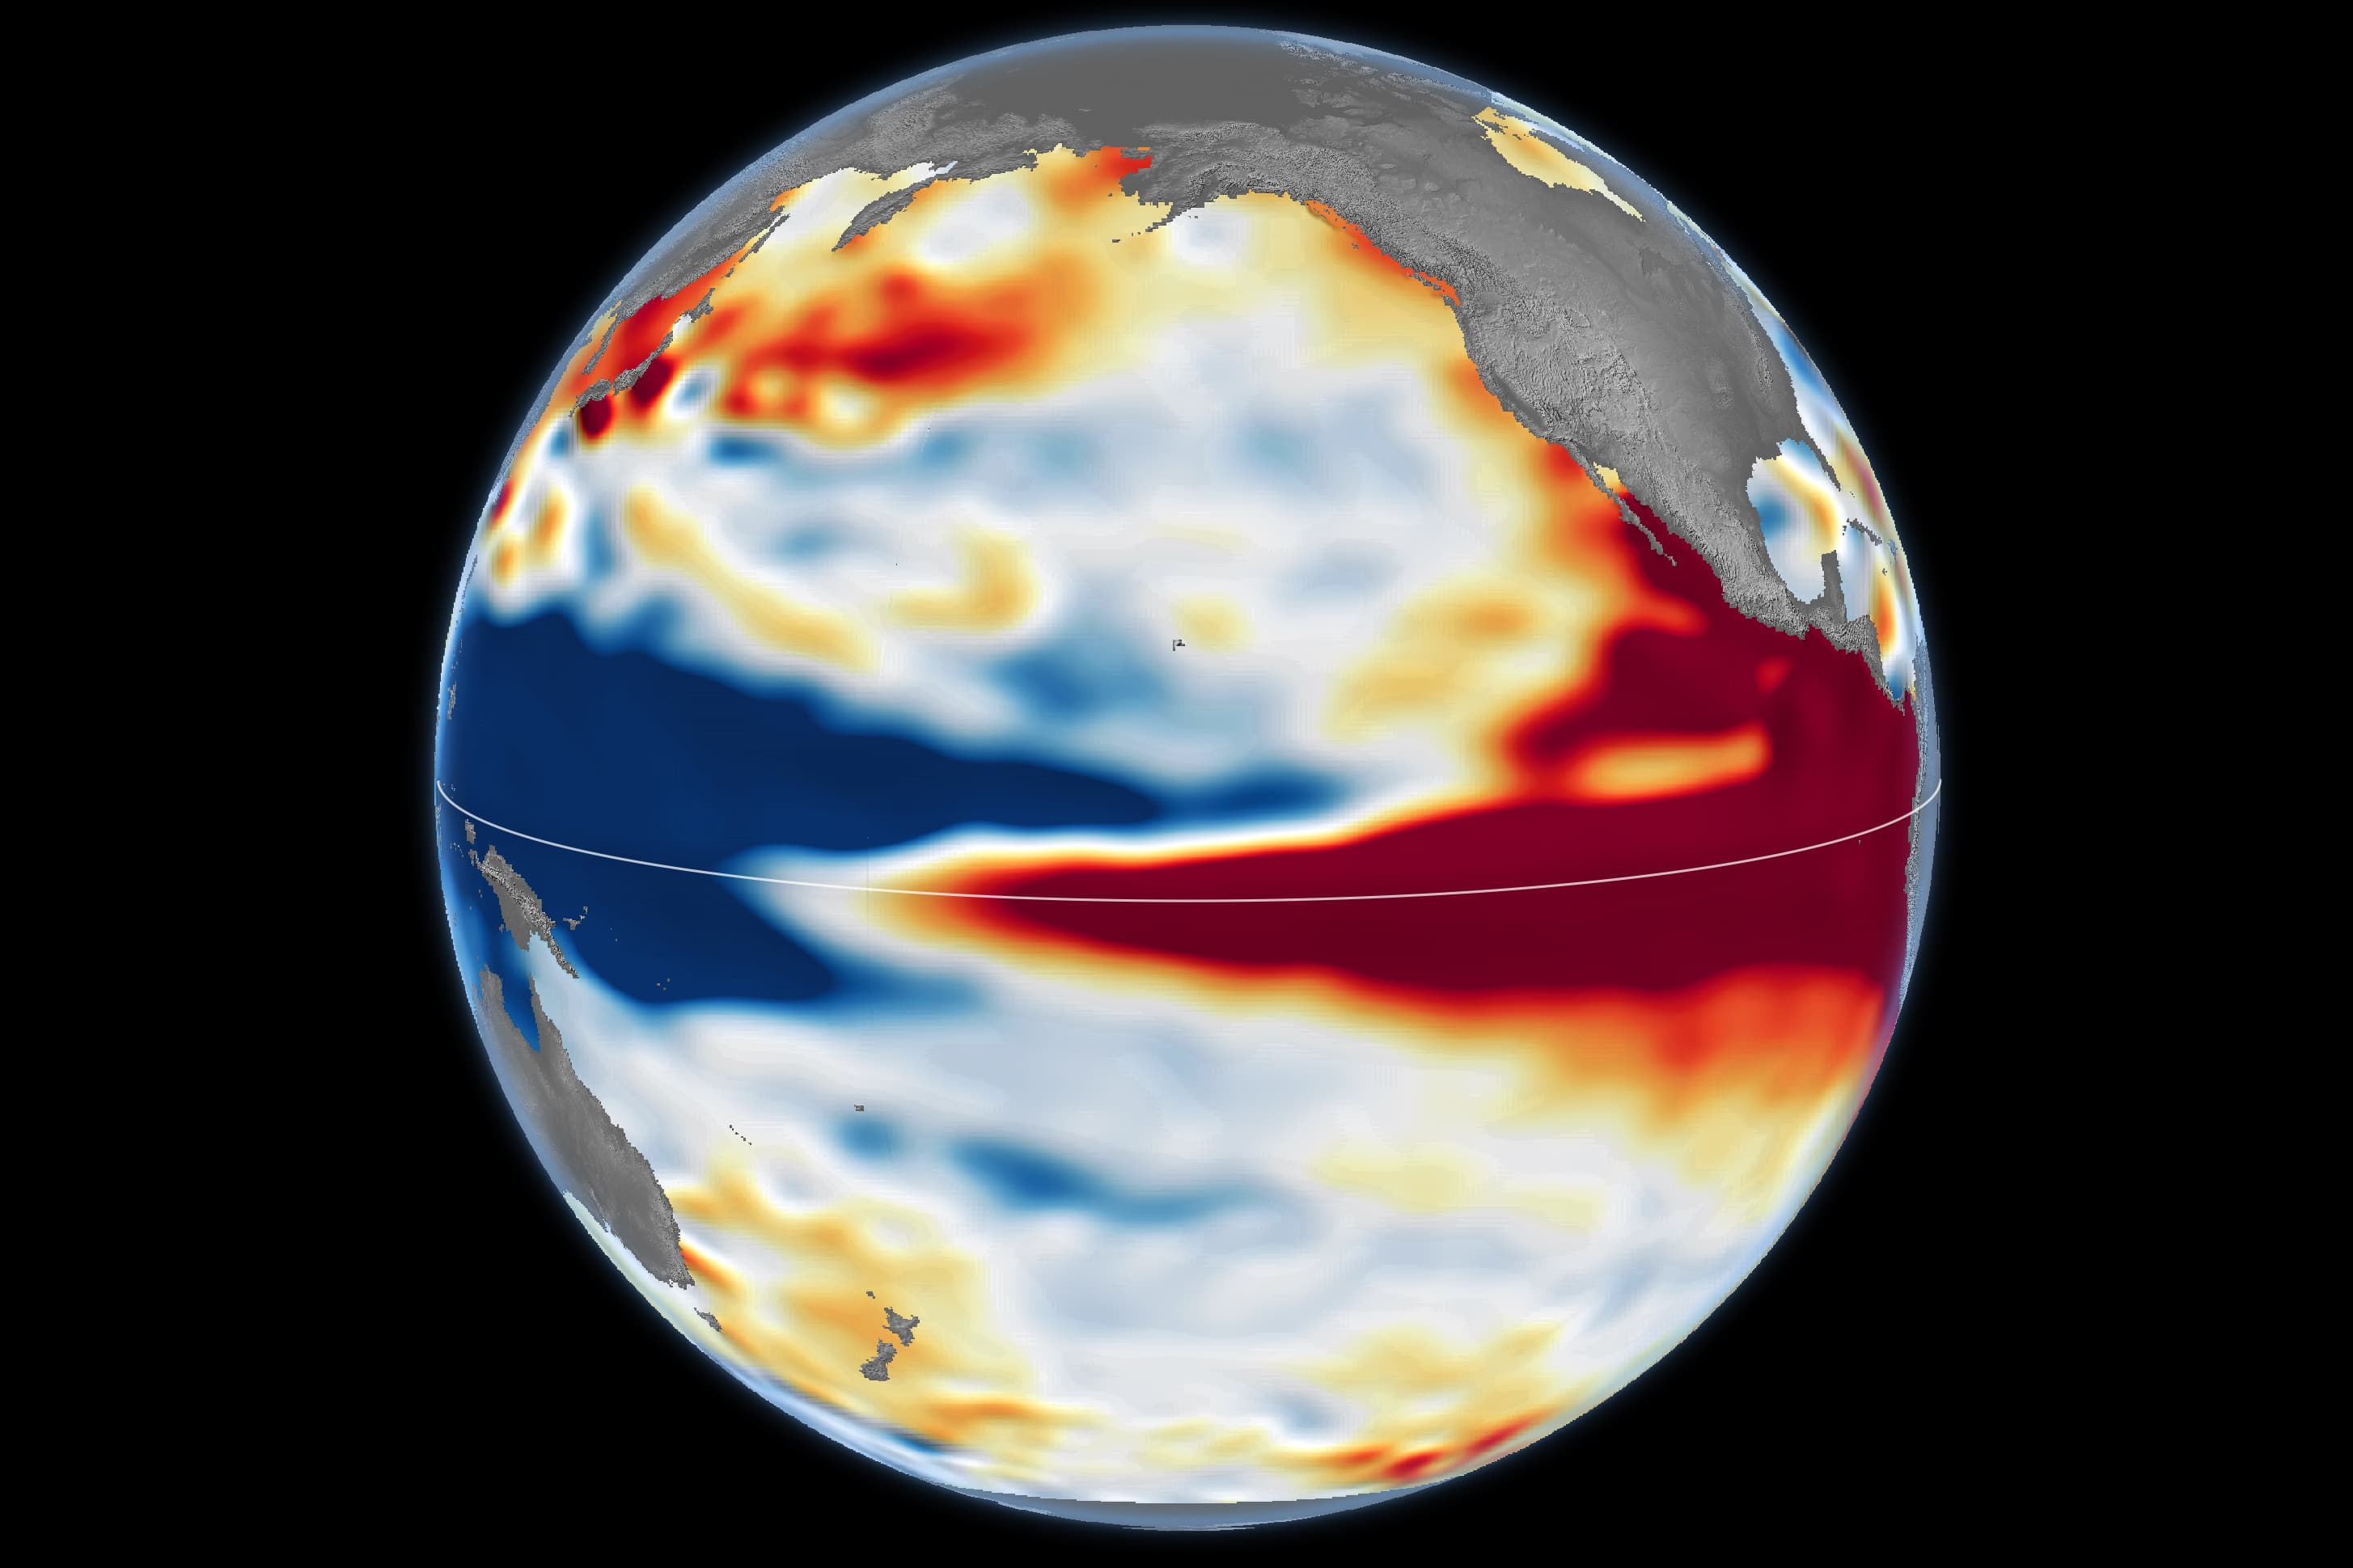
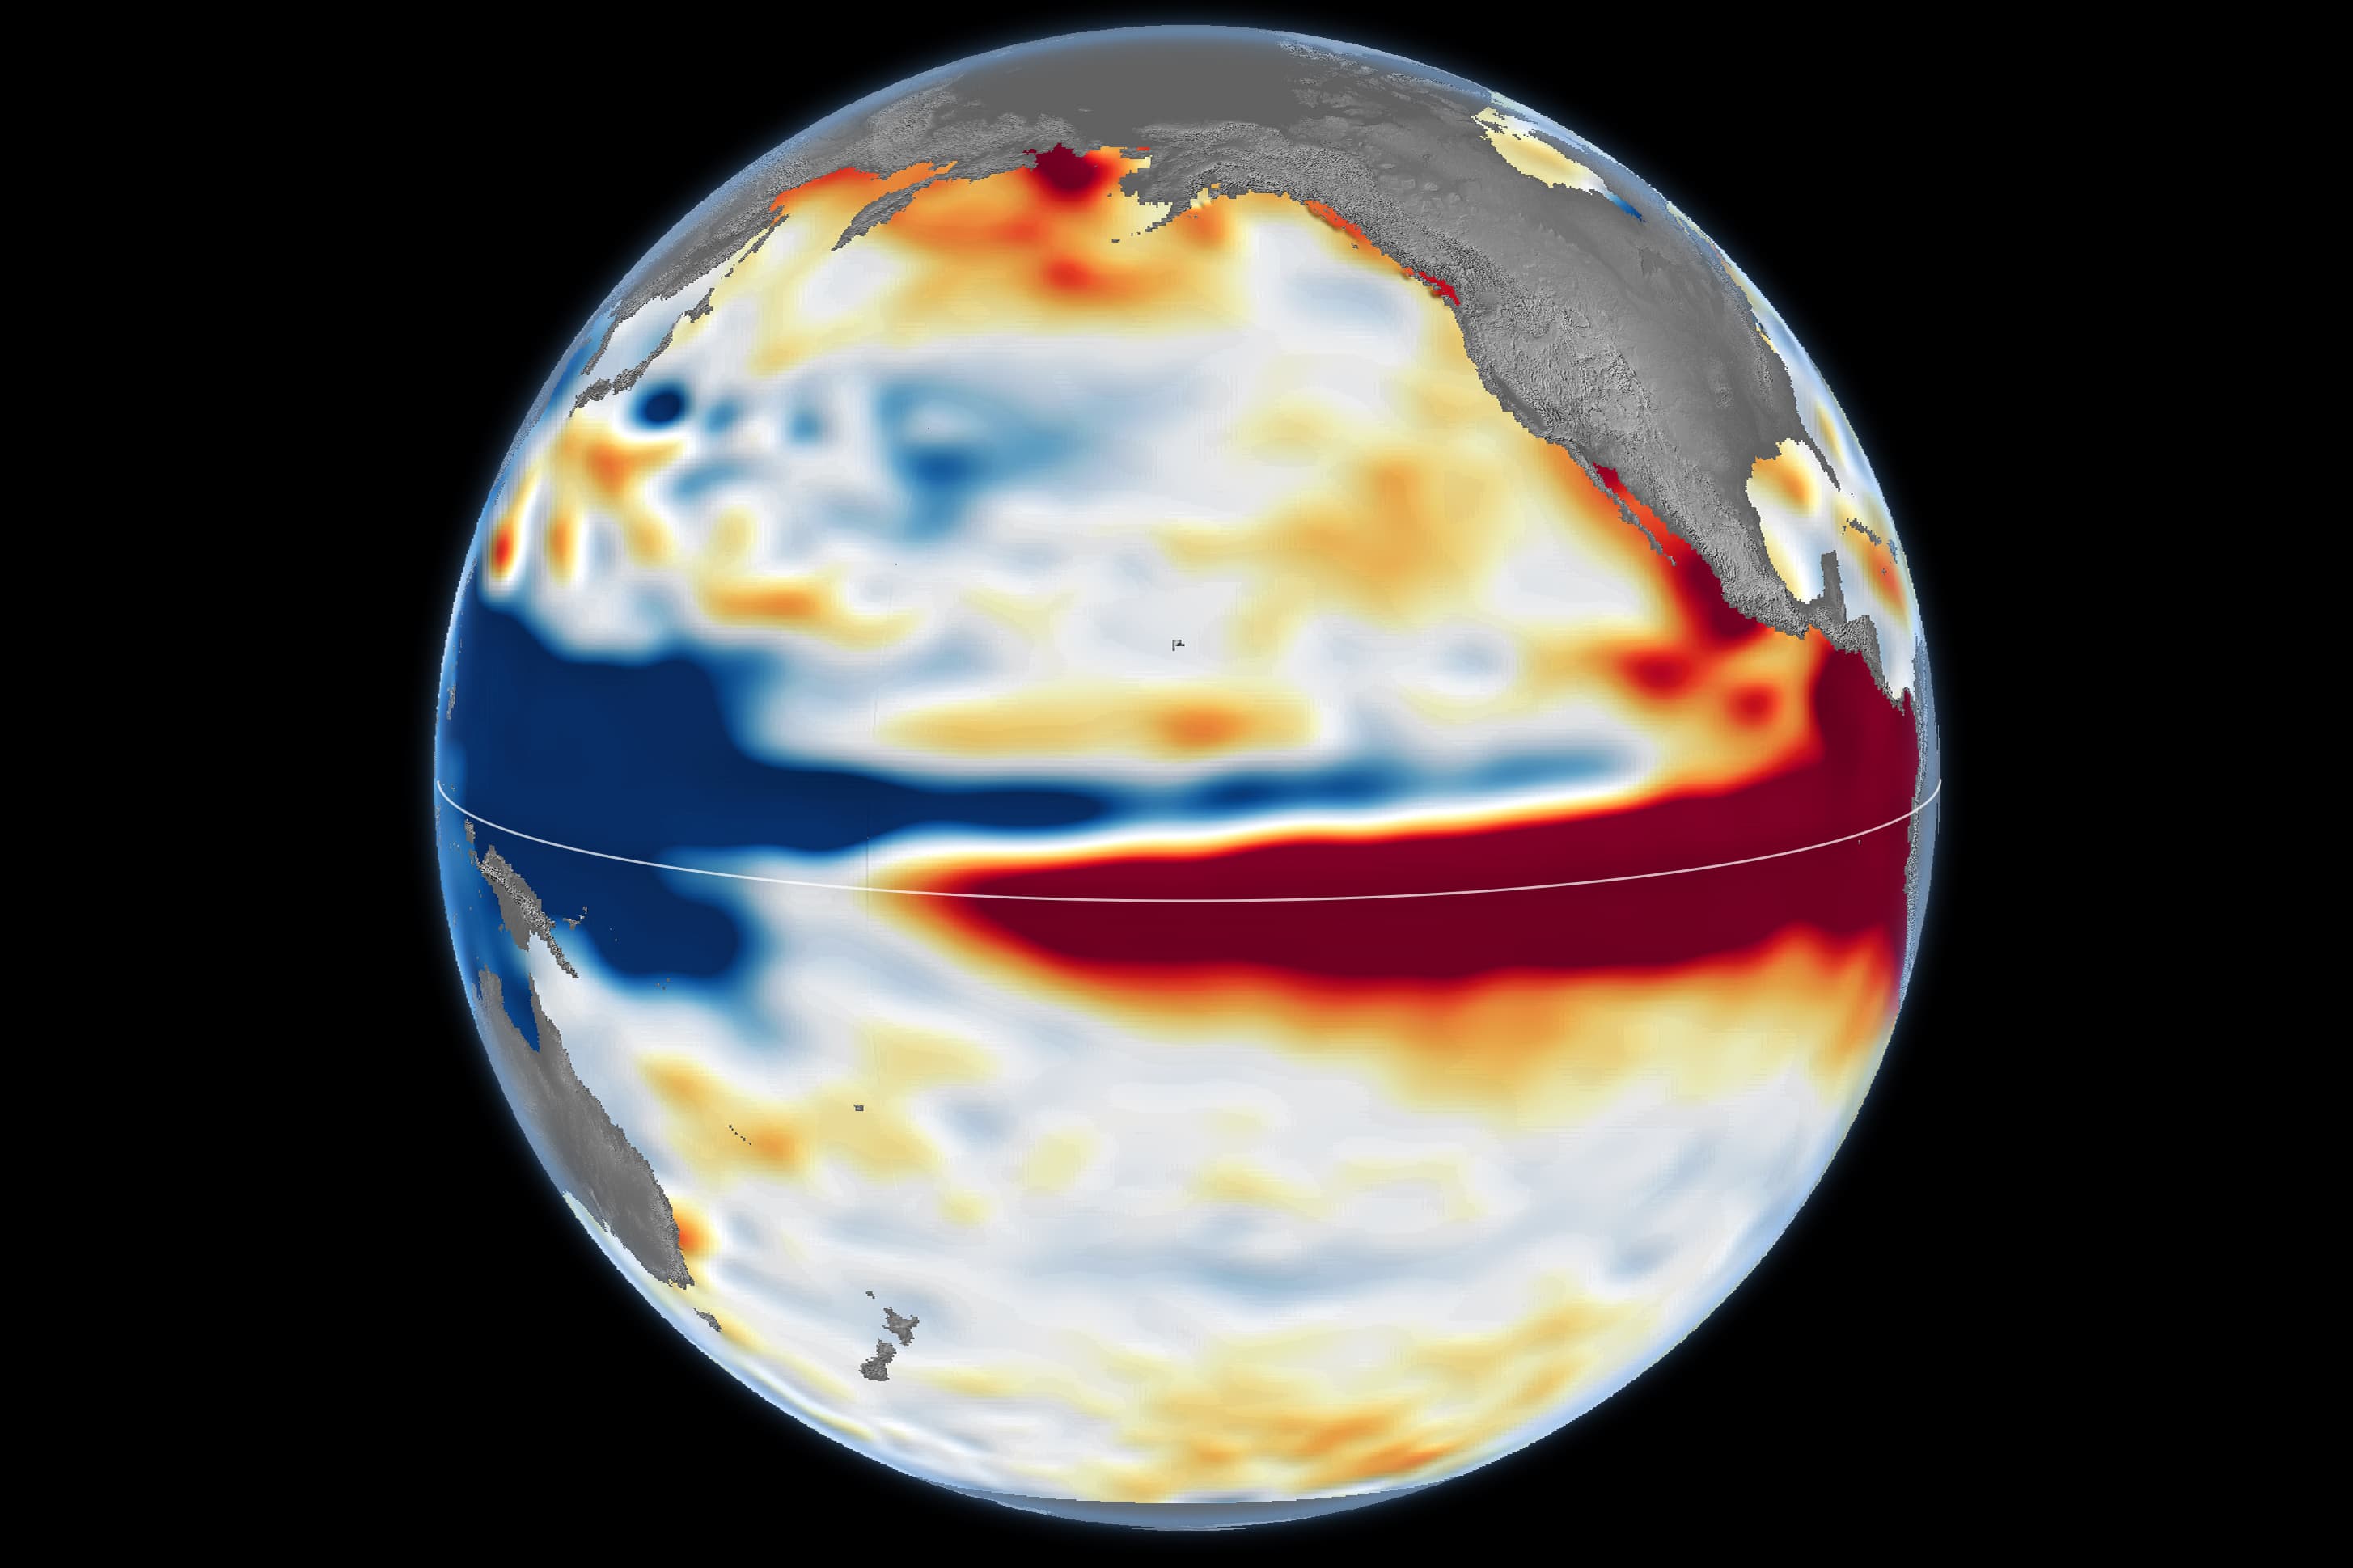
The map of the Pacific released by NASA on October 23, 2026 is almost entirely told in color: vast red areas stretch along the equator. They represent a sea surface higher than its usual value at that time. Comparison with October 1997, the year of a major El Niño, provides a historical landmark. It does not mean that the two episodes will produce exactly the same consequences.
What does Sentinel-6 actually measure?
A radar altimeter sends pulses to the ocean and measures the time it takes for the echo to return. By combining this time with the precise position of the satellite and instrumental corrections, scientists estimate the height of the sea surface. The map therefore shows neither temperature directly nor clouds, but an anomaly in height relative to a reference. For October 2026, NASA uses data from: Sentinel-6 Michael Freilich; for October 1997, those from TOPEX/Poseidon.
Why a Higher Sea Accompanies El Niño
During El Niño, trade winds weaken and warm water accumulated in the western Pacific moves toward the center and east. Warmer water expands, which helps to raise the surface locally. Kelvin ocean waves are involved in the transfer of this heat eastward. Altimeter maps allow for this evolution to be tracked for thousands of kilometers, with continuity of satellite measurements going backwards. In the 1990s
However, maps should be read as part of an observation system. Scientists cross-reference sea level with surface temperatures, buoy measurements, winds and other data. A red zone is neither a temperature displayed in degrees nor proof that it will rain in a particular location. The overall intensity of El Niño and local weather are two different issues.
What about Africa?
Past El Niño events have been associated with droughts in southern Africa, but the influence varies according to regions, seasons and the atmospheric circulation of the year. Therefore, rainfall in Cameroon, the Sahel or southern African cannot be inferred from this single map of the Pacific. The Commission has not yet adopted a proposal for a directive.
The value of these satellites is that they can show a planetary evolution early enough to enrich models and monitoring, so the correct reading is: this is a strong ocean signal to analyze , not here is the weather of tomorrow .